

By late March, many tax teams are running the same playbook they ran years ago. Preparers move fast, reviewers slow everything down, partners inherit the final anxiety, and everyone hopes a careful set of eyes will catch what the process didn't prevent.
That approach still feels responsible. It also creates a bottleneck. Manual review turns quality control into a seasonal rescue mission instead of a managed system. The firms that get ahead don't just ask whether reviewers found errors. They ask which quality control metrics show where risk starts, where time gets wasted, and whether a modern review process is defensible when regulators or partners ask hard questions.
The shift matters even more now that AI-assisted review is entering mainstream tax workflows. The core question isn't whether software can flag discrepancies. It's whether your firm can measure the trade-off between review time, missed issues, and audit-readiness well enough to trust a review-by-exception model.
Table of Contents
- Beyond the Bottleneck of Manual Tax Review
- The Regulatory Mandate for Tax Quality Control
- Essential Quality Control Metrics for 1040 Review
- Visualizing Performance with a QC Dashboard
- Advanced Metrics for AI-Powered Tax Review
- Your Four-Phase QC Metrics Implementation Roadmap
- Transforming Your Practice from Reactive to Defensible
Beyond the Bottleneck of Manual Tax Review
A familiar scene plays out in every busy season. A reviewer opens a drafted 1040, source documents are spread across multiple PDFs, workpapers sit in different folders, and the review turns into line-by-line comparison by memory, habit, and stamina. If the preparer is strong, the file moves. If the preparer is uneven, the reviewer becomes the control system.
That's where many firms confuse effort with quality. Long reviews can feel thorough, but they often hide a weak upstream process. The primary cost isn't just reviewer fatigue. It's the risk that a discrepancy survives because the process depends on eyeballing instead of structured exception handling.
That risk is not abstract. A study discussed by CPA Trendlines reported that paid tax preparers increased taxpayers' underreporting of income by approximately $3,900 per return, which shows how expensive preparer error can become when firms don't have rigorous review controls in place (CPA Trendlines on tax review procedures and preparer underreporting risk).
Practical rule: If your QC process depends on reviewer heroics, you don't have a scalable QC process.
Manual review also creates uneven economics inside the firm. Senior people spend time proving basic inputs instead of focusing on judgment, planning, and client issues. Review queues build. Turnaround stretches. Staff training gets reactive because managers are too busy clearing work to diagnose patterns.
A better system starts by measuring what occurs in review. Firms need quality control metrics that show:
- Where discrepancies originate: preparer input, missing source data, reconciliation failure, or reviewer inconsistency.
- Where time gets consumed: intake, preparation, first review, rework, or partner sign-off.
- Where risk remains hidden: incomplete documentation, weak sign-off history, or unclear exception resolution.
Once those measures are visible, QC stops being a seasonal bottleneck and starts becoming an operating discipline.
The Regulatory Mandate for Tax Quality Control
Tax quality control isn't just an efficiency project. It sits inside a professional framework that already expects firms to operate with documented controls.
The central foundation is the AICPA's Statement on Quality Control Standards No. 8. As summarized by the Journal of Accountancy, the standard requires CPA firms to maintain a system built on six elements: leadership responsibilities for quality, relevant ethical requirements, acceptance and continuance of client relationships, human resources, engagement performance, and monitoring. The same discussion makes clear that these elements apply to tax practices and are reinforced by Circular 230, which makes quality control a binding expectation in practice (Journal of Accountancy on SQCS No. 8 and tax practice quality control).
The six elements in a tax context
A lot of firms hear those six elements and think audit methodology. That's too narrow. In a tax practice, each one maps directly to the return lifecycle.
Leadership responsibilities for quality
Partners have to define what acceptable review looks like. If one office requires documented reconciliation and another relies on informal sign-off, the firm doesn't have one QC system. It has competing habits.Relevant ethical requirements
Ethics in tax QC isn't limited to independence language. It includes whether teams escalate uncertain positions, document assumptions, and avoid treating deadline pressure as a reason to skip review steps.Acceptance and continuance of client relationships
Some quality failures start before preparation begins. Disorganized source records, unrealistic deadlines, or persistent information gaps should affect whether the client is a fit and what workflow controls are required.Human resources
Staffing is a QC issue. Assigning complex returns to undertrained preparers and expecting reviewers to clean up the file is not quality control. It's deferred correction.Engagement performance
Review procedures are integral to this area. Returns need a documented process for detecting errors before filing, not a vague expectation that someone experienced will notice a problem.Monitoring
Monitoring is where metrics become indispensable. If the firm isn't measuring review exceptions, rework, documentation quality, and process drift, it can't show that the system is functioning.
What this means in practice
The regulatory point is simple. A tax firm needs documented procedures that run from intake through retention, and those procedures have to work before filing season pressure hits.
A review checklist by itself doesn't satisfy the deeper requirement. Firms need evidence that their system is designed, followed, and monitored.
That's why quality control metrics matter. They translate broad standards into operating proof. Leadership can see whether the process is being applied. Review managers can identify where files break down. Partners can defend the workflow if someone asks how a review-by-exception model is controlled.
A manual checklist can document intent. Metrics document performance.
Essential Quality Control Metrics for 1040 Review
Most firms begin with one metric. Error rate. That's useful, but it's nowhere near enough. A 1040 review process needs a small group of measures that expose workload, accuracy, delay, and process discipline at the same time.
What a useful metric looks like
A useful metric does three things. It has a clear formula, it points to an action, and it can be reviewed consistently across preparers and reviewers.
If a metric produces debate but no decision, drop it. If it creates work but doesn't change behavior, simplify it. A solid QC scorecard should help a review manager answer practical questions fast:
- Is the file clean on first pass, or do we keep recycling the same returns?
- Are reviewers spending time on complex issues, or on preventable prep mistakes?
- Are deadlines slipping because of volume, uneven staffing, or poor file readiness?
The fastest way to make this real is to define the core measures plainly.
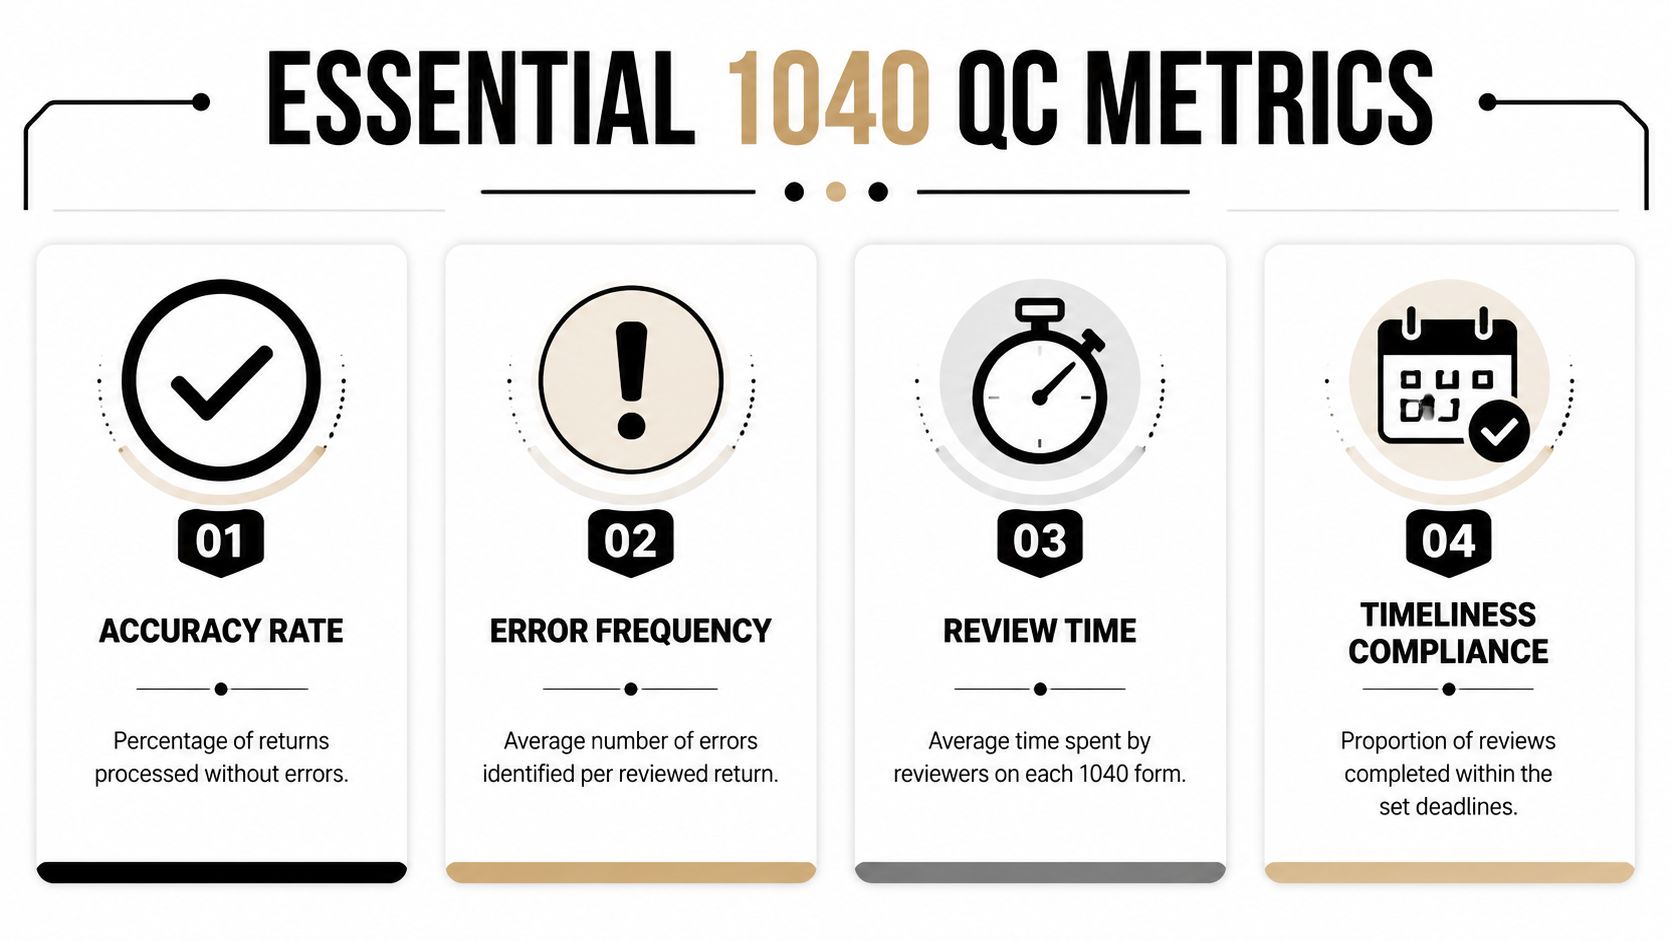
The core scorecard for 1040 review
| Metric | Formula | What It Measures |
|---|---|---|
| Accuracy Rate | Error-free reviewed returns / total reviewed returns | How often returns pass review without identified errors |
| Discrepancy Rate | Total identified discrepancies / total reviewed returns | How frequently reviewers find issues that require correction or explanation |
| Turnaround Time | Total review cycle time / total reviewed returns | How long files take to move from submission to review completion |
| Rework Rate | Returns sent back for correction / total reviewed returns | How often review creates another preparation cycle |
| Reviewer Coverage | Returns reviewed by each reviewer / total reviewed returns | How review workload is distributed across the team |
These formulas don't need to be mathematically complex. They need to be operationally honest.
A strong accuracy rate tells you that preparers are submitting cleaner work. A weak one usually points to one of three causes: staff capability, unclear prep standards, or inconsistent source reconciliation.
A rising discrepancy rate can mean quality is deteriorating, but context matters. It can also mean your reviewers or software are surfacing issues more systematically than before. That's why discrepancy rate should always be read with rework and turnaround.
A sluggish turnaround time often gets blamed on staffing. Sometimes that's true. Often it reflects poor file readiness. Returns sit because source documents aren't fully tied out, reviewer notes aren't standardized, or the same issues recur across multiple preparers.
Don't ask only how long review takes. Ask what kind of work consumed the time.
A high rework rate is one of the cleanest indicators of waste in the system. When files repeatedly go back to preparers, the firm is paying for the same return more than once. That usually signals training problems, weak workpaper standards, or a prep process that isn't catching obvious mismatches before review.
Reviewer coverage is the metric many firms skip. They shouldn't. If one partner or senior manager becomes the default closer on difficult files, the whole QC process becomes fragile. Coverage data shows whether bottlenecks come from volume or from over-reliance on a few people.
How to use these metrics without overbuilding
The best 1040 scorecards stay lean. Start with a review packet that can be captured in existing workflow tools or workpaper systems. Then make each metric answer one management question.
- Accuracy Rate: Should we coach preparers, adjust templates, or tighten intake?
- Discrepancy Rate: Are reviewers finding isolated mistakes or repeated categories of failure?
- Turnaround Time: Where are files stalling before sign-off?
- Rework Rate: Which preparers or return types create repeat handling?
- Reviewer Coverage: Are we building a resilient review team or a single-point dependency?
For firms refining document tie-out processes, a practical tax reconciliation example for 1040 workflows helps show how source validation and drafted-return comparison should connect before the reviewer ever opens the file.
What doesn't work is collecting metrics as a compliance ornament. Quality control metrics should trigger staffing changes, workflow redesign, or training decisions. Otherwise, they become one more report nobody trusts in April.
Visualizing Performance with a QC Dashboard
A good dashboard changes the conversation in the review room. Instead of hearing that “review feels slower” or “this team is struggling,” partners can see whether turnaround is drifting, whether rework is clustered around certain preparers, and whether quality holds when volume spikes.
That matters because tax review problems usually don't announce themselves clearly. They show up as queue growth, late partner touches, and repeated reviewer comments long before anyone labels them systemic.
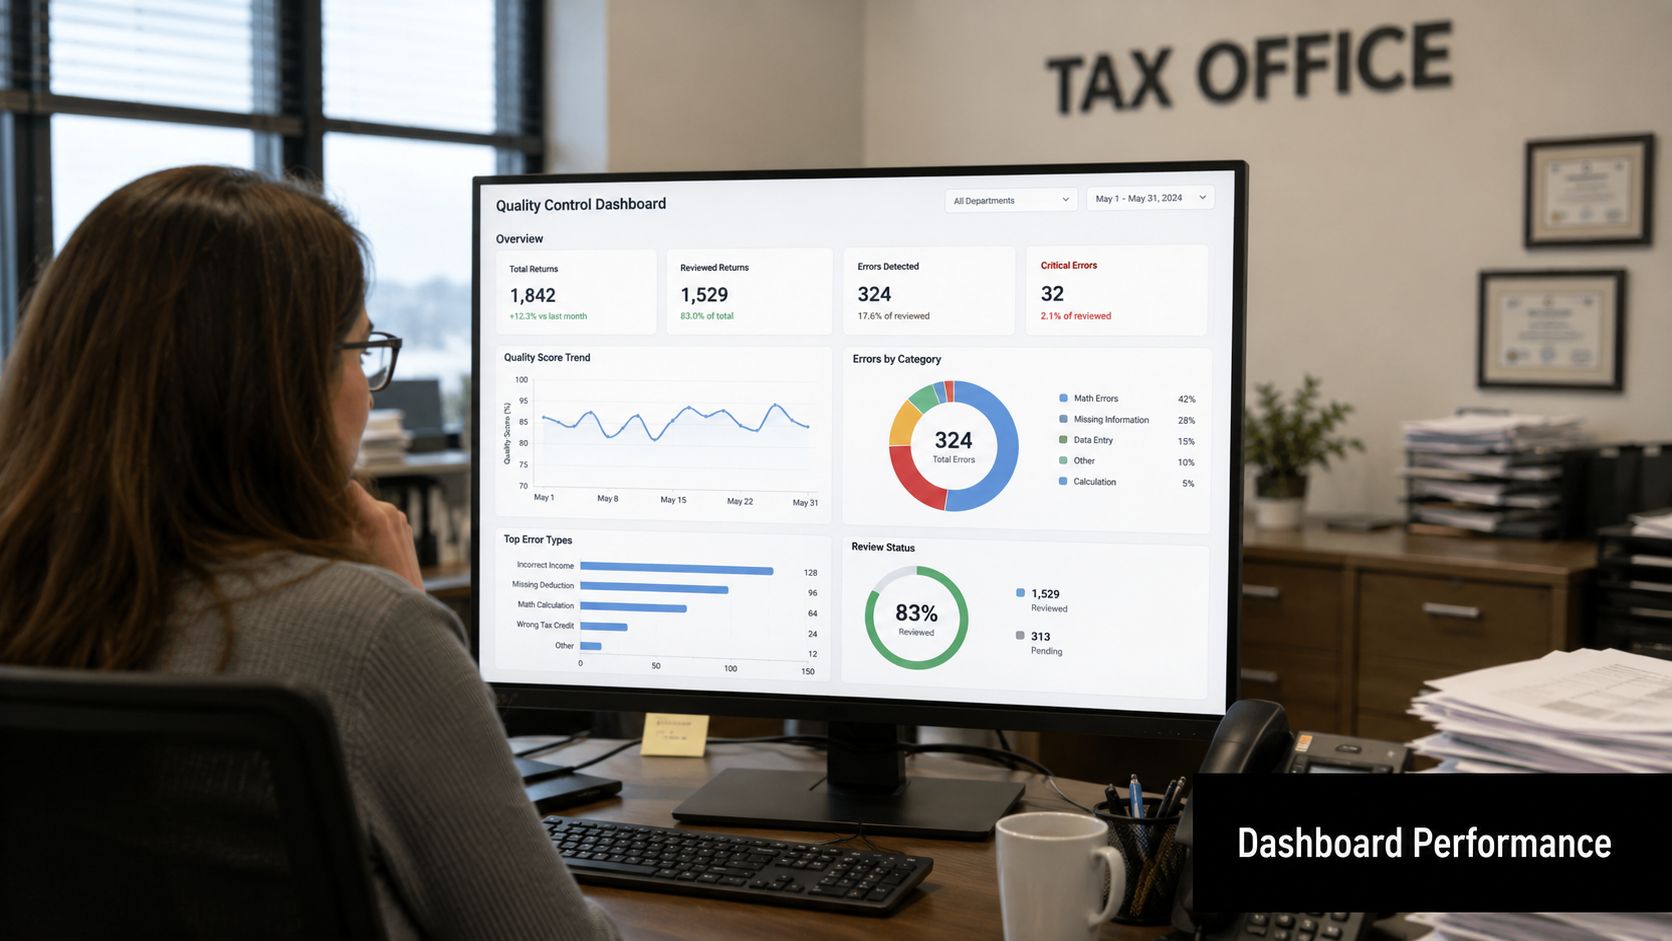
What a partner should see at a glance
The most useful QC dashboard isn't crowded. It usually contains a small set of trend views across the filing season, segmented by preparer, reviewer, office, or return type.
A practical dashboard should show:
- Accuracy trend over time: whether quality is stable or declining as deadlines approach.
- Turnaround trend by stage: whether delay occurs before first review, after reviewer notes, or at final sign-off.
- Rework concentration: which preparers, return categories, or document types generate repeat cycles.
- Workload distribution: whether reviewer capacity is balanced or compressed around a few people.
This kind of dashboard gives leadership two immediate advantages. First, it separates isolated bad files from process patterns. Second, it helps determine whether the right fix is coaching, staffing, or technology.
What changes when trends replace anecdotes
Consider a common scenario. One manager believes a senior preparer is overloaded. Another believes the issue is weak first-pass quality from newer staff. The dashboard can settle that quickly. If turnaround rises while discrepancy and rework rates stay flat, capacity may be the issue. If rework climbs sharply around a subset of preparers, coaching or standardized prep steps are more likely the answer.
A visual dashboard also helps with positive decisions. Firms can identify reviewers whose files stay clean without creating delay. Those people often belong in mentoring or calibration roles because they're not just fast. They're consistent.
When QC data is visible, management stops rewarding the loudest opinion and starts rewarding the clearest process.
The dashboard should also support partner-level investment decisions. If the team can see that review time stays high even when file complexity is stable, that's a sign the process still relies too heavily on manual proof. At that point, the dashboard isn't just operational. It becomes part of the business case for a more automated review model.
Advanced Metrics for AI-Powered Tax Review
A partner signs off on a return in half the usual time because the AI review queue showed only three exceptions. Two months later, a regulator or plaintiff's expert is not going to ask whether the software felt efficient. They are going to ask what the firm reviewed, what it accepted, what it overrode, and what record exists to prove that judgment.
Once AI enters the review process, the scorecard has to change. Accuracy, turnaround, and rework still matter, but they are operating metrics. They do not answer the harder partner question. Did the firm reduce review labor without weakening its ability to defend the return and the process behind it?

Why traditional metrics stop short
Manual review economics and AI review economics are different. In a manual model, the firm pays for broad human inspection and accepts the drag on realization. In an AI-assisted model, the firm is making a more precise trade-off. It is spending less time on files that appear clean and concentrating reviewer attention on exceptions, outliers, and areas with higher tax risk.
That shift creates a measurement gap. A low error rate by itself does not prove the process is sound. It may mean the preparers performed well. It may mean reviewers are catching the right issues. It may also mean the system is not surfacing enough of the right exceptions for human review. Those are very different conclusions, and only one supports a credible ROI case.
For that reason, firms need a second layer of QC metrics. The first layer measures throughput and consistency. The second measures detection quality, override behavior, and documentation strength.
The AI-era metrics that matter
Start with system judgment quality.
- False positive rate: how often the system flags an issue that the reviewer clears as acceptable. If this stays high, reviewers lose confidence and waste time clearing noise.
- False negative rate: how often a real issue was present but the system did not surface it. This is the costlier failure because it goes directly to filing risk and review exposure.
- Error severity: whether the missed or flagged issue is minor, moderate, or material. Firms should not weigh a formatting inconsistency the same way they weigh omitted income support or a basis problem.
- Exception resolution time: how long it takes a reviewer to evaluate and close AI-generated exceptions. Falling resolution time usually shows better triage rules, better staff training, or both.
- Override frequency: how often reviewers bypass the system's recommendation, force additional review steps, or clear items the model escalated. High override rates can signal either weak model tuning or weak review discipline.
These measures let partners evaluate AI the way they evaluate any other process investment. What risk did it reduce, what labor did it save, and what new control points did it introduce?
The next category matters just as much. Audit-readiness metrics, especially Audit Trail Completeness.
This is the metric many firms understate because it does not look like a classic productivity KPI. In practice, it often carries more regulatory and litigation value than a modest improvement in raw review speed. A clean audit trail gives the firm something manual review often struggles to produce consistently: proof of who reviewed what, what was cleared, what was escalated, and what support sat behind the conclusion. The AICPA's quality management framework reinforces the need for monitoring, documentation, and evidence of process design rather than relying on informal reviewer memory or scattered notes (AICPA quality management standards and implementation resources).
In practical terms, Audit Trail Completeness should test whether the file preserves:
- Source-linked support: conclusions tie back to workpapers, source documents, and imported client data.
- Timestamped actions: the record shows when an item was reviewed, cleared, escalated, or reassigned.
- Role-based sign-offs: preparer, reviewer, manager, and partner actions are distinct.
- Exception history: cleared issues remain visible in the record instead of disappearing into email or side notes.
- Binder integrity: the final file reflects the actual review path from intake through approval.
I would treat that metric as part of the ROI case, not just part of compliance. A firm that saves review hours but cannot reconstruct the approval history has created a fragile process. A firm that saves review hours and strengthens its file-level evidence has improved realization and improved defensibility at the same time.
That is why comparing workflows with modern AI tax software built for review-by-exception workflows should include more than speed tests or user preference surveys. The better comparison asks four questions. Did the tool reduce low-value review time? Did it surface the right exceptions? Did reviewers use it consistently? Did the final file preserve a complete enough record to withstand scrutiny?
The strongest AI workflow reduces reviewer effort and leaves behind a file that clearly shows how the firm reached its conclusions.
Firms that stop at simple error rates miss the real decision. The AI era requires QC metrics that support three audiences at once: operations leaders looking for efficiency, partners looking for margin, and regulators looking for evidence.
Your Four-Phase QC Metrics Implementation Roadmap
Busy season, a partner asks why review hours climbed, error rates look flat, and no one can show which files consumed the extra time. That is the point where many firms realize their QC process is measuring activity, not control.
A workable roadmap starts with a narrower goal. Build a QC system the firm can defend, price, and improve. That means measuring review quality, labor consumption, and documentation strength together, rather than treating error rate as the whole story.
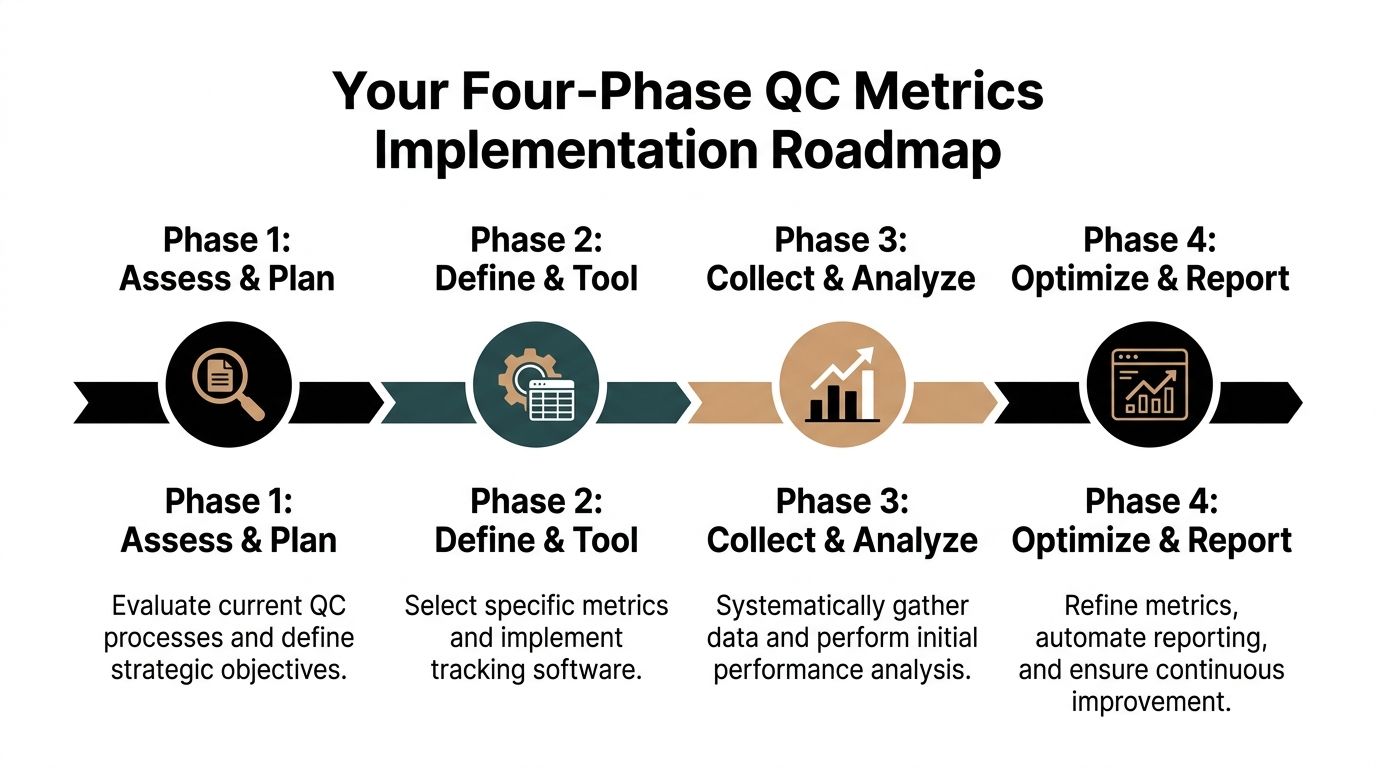
Phase 1 and Phase 2
Phase 1 is benchmark the present.
Start by observing the current review process without trying to fix it midstream. Pull a defined sample of returns from one office, one reviewer pool, or one filing segment and measure first-pass review results, rework volume, cycle time by handoff, and how often support in the file is sufficient to explain the reviewer's conclusion.
Map the labor as carefully as the errors. In practice, the key AI adoption question is rarely, “Did review time go down?” It is, “Did the firm reduce low-value review time without increasing the cost of missed issues or weakening the file record?” That is why I would baseline partner review hours, manager touch time, and the effort required to reconstruct a file after the fact. Those costs usually sit outside the old checklist, but they matter to realization and to defensibility.
Phase 2 is define and pilot.
Choose a scorecard that a reviewer can explain file by file. For many firms, that means one measure for quality, one for turnaround, one for rework, and one for documentation strength, with Audit Trail Completeness included early rather than treated as a later compliance add-on.
Keep the pilot tight. One team is enough if the files are representative and leadership is willing to inspect the underlying work, not just the dashboard. That is how firms avoid a common failure point. The metric definition looks clear in a meeting, then falls apart when two reviewers classify the same issue differently.
Phase 3 and Phase 4
Phase 3 is integrate and automate.
Once the scorecard holds up in real files, connect metric capture to the review workflow itself. Exceptions, status changes, sign-offs, and resolution history should be recorded as part of normal review. If staff have to update a spreadsheet after finishing the return, the data will drift and the process will lose credibility.
Use automation where the payoff is clear. Repetitive tie-out work, document comparison, exception logging, and routing are good candidates. Judgment stays with the reviewer. Interpretation, escalation, and approval still belong to the preparer, reviewer, manager, and partner chain. Firms evaluating systems at this stage should pay close attention to whether the platform creates a durable audit trail software for tax review workflows record, because speed without file-level evidence is a weak trade.
Phase 4 is refine and scale.
After one full cycle, review the scorecard against actual management decisions. Keep the measures that changed staffing, training, review scope, or technology use. Cut the ones that produced interesting charts but no action.
Good signs show up quickly:
- Leaders use the metrics in staffing and review assignment decisions: not only in post-season summaries.
- Reviewer classifications become more consistent: the firm is calibrating judgment across teams.
- Low-value review time drops while escalation quality holds: efficiency is improving without hiding risk.
- Audit Trail Completeness improves: the file is easier to defend even as manual proof work declines.
- Partners can explain the economics of the process: where time was saved, where risk still sits, and why the workflow is supportable.
Build slowly enough to earn trust. Automate only after the firm agrees on what “good” looks like.
That order matters. QC modernization fails when firms install technology before they define the control objective, or when they chase efficiency metrics and leave documentation quality for later. A better rollout treats ROI and defensibility as part of the same system. That is the standard a modern tax practice should be aiming for.
Transforming Your Practice from Reactive to Defensible
The point of quality control metrics isn't to micromanage preparers or produce prettier reports for partner meetings. The point is to replace a reactive review culture with a process that is visible, repeatable, and supportable when someone asks how the firm knows a return was reviewed properly.
That change starts with basic operating measures such as accuracy, turnaround, rework, and reviewer coverage. It matures when the firm adds AI-era measures that test whether review by exception is trustworthy, especially around missed discrepancies and documentation integrity. At that stage, QC stops being a checklist and becomes a system.
A modern tax practice also needs a stronger record than “the reviewer looked at it.” It needs a file history that shows what was tied out, what was flagged, who cleared it, and how the final binder supports the conclusion. That's where tools built around a durable audit trail software for tax review workflows model become relevant to the broader QC discussion.
The firms that get this right will spend less partner time on low-value proof work, train staff from patterns instead of anecdotes, and defend their process with more confidence when scrutiny arrives.
If your firm is rethinking how to move from manual tax review to a faster, more defensible review-by-exception workflow, WP TieOut is built for that transition. It helps tax teams validate source documents, compare drafted 1040s against workpapers, surface true discrepancies, and preserve a source-linked sign-off history that supports both efficiency and audit-readiness.